What an anticipated adverse weather day table is actually for
Every commercial schedule comes with risk. Weather is the most common and most predictable variable, but it is never fully under control. Owners and GCs both want to define in advance how much weather is "built in" to the agreed project duration, so they know where risk and cost sit when the rain hits. This is where the anticipated adverse weather day table comes in.
The table is a pre-set count of the number of days each month expected to be lost or heavily impacted by weather, based on historical records. Once the contract is signed, both sides use this table as the yardstick. If the project loses more days to weather than the table allows, the contractor may be entitled to a time extension. If the project loses fewer, delivery expectations remain unchanged.
Without a clearly defined baseline, every wet week becomes a debate. With one, weather claims can be managed on facts, not gut feeling. This transparency is why most federal projects and nearly all large commercial jobs require a weather day allowance as part of the scheduling documents.
Keep reading: How a Florida Patient Tower Got 31 of 34 Weather Days Approved
Pulling the 1991 to 2020 climate normals for your county
Climate normals are thirty-year averages calculated by the National Oceanic and Atmospheric Administration (NOAA). For construction, the most recent set, 1991 to 2020, gives a stable reference for what "normal" weather looks like in your project location.
To use these normals, you start with the county or nearest weather station to your job site. NOAA publishes monthly tables for each station, covering precipitation, temperature, and other variables. These are available through the NOAA National Centers for Environmental Information. Most contractors use the daily summaries for precipitation, which report how many days per month, on average, a station recorded measurable rain or snow over the thirty-year period.
It pays to confirm which station best matches your site. For jobs on the edge of a county, or in areas with varying elevation, station data can differ. Owners sometimes push for the station with lower averages, so be prepared to show why your pick reflects site conditions.
Choosing the threshold that defines a lost day for your scope
Not every wet day is a lost construction day. The amount and timing of precipitation matter, as do temperature and wind. To make a defensible weather table, you must define what weather actually stops the work you plan to perform in that period.
Precipitation thresholds
Many schedules use a threshold like 0.10 inch or 0.25 inch of precipitation in 24 hours. Below this, most exterior trades can work, though conditions may be muddy. Above it, earthwork, concrete, roofing, and other scopes may not be feasible. Some trades, steel erection, for example, may only stop for much higher amounts, while painting or paving might use even lower cutoffs.
Temperature and wind thresholds
For temperature, cold weather can halt concrete pours or masonry, usually below 40 degrees Fahrenheit, though the exact number depends on mix design and protection measures. Wind affects crane picks, lifts, hoisting, and work at height. Common wind thresholds are 20 to 25 miles per hour, but check local codes and manufacturer recommendations for your specific equipment.
State your thresholds in the contract documents, referencing the NOAA data and your own means and methods. This keeps the weather table connected to your actual work, not just a generic average.
Keep reading: Named Stations and Weather Day Tables in Newer Owner Contracts
Counting days with measurable precipitation, month by month
Once you have the right station, the right thresholds, and the right months, you can count. Start with the NOAA climate normals table for your station. For each month, look at the column showing the average number of days with precipitation over your chosen threshold.
For example, if the table shows an average of 8 days in April with at least 0.10 inch of precipitation, that is your baseline for April. Repeat for every month of your scheduled work. If your job runs October to March, those are the only months you need in your allowance table.
Some GCs use a rolling twelve-month table for long projects. Others recalculate if the schedule shifts seasons. The key is to use the monthly breakdown, not just an annual total. Weather patterns are not even. Spring and fall often bring more wet days than summer. Owners sometimes try to average the year, which can shortchange the allowance during wet months and pad it during dry ones.
Adding wind, temperature and dry out days to the monthly count
Precipitation is not the whole story, especially for scopes sensitive to wind or cold. Many contracts now include additional allowances for days lost to high wind or low temperature, based on NOAA wind and temperature normals.
Wind days
NOAA does not always publish daily wind gust data for every station, but larger airports and some regional stations do. To count wind days, look for the average number of days per month where gusts exceed your equipment's limit. If no data is available for your site, refer to the nearest large station and document the choice.
Temperature days
Cold weather days are counted the same way, using the NOAA normal for days per month with a high below your threshold. For concrete or masonry, you may only need to count days where the low falls below freezing, if your mix designs allow for cold weather work.
Dry out days
Some scopes require not just a rain-free day, but also a period of drying. Excavation, paving, and roofing may need a day or two after heavy rain before work can safely restart. To build this into your table, you can add a dry out day after each significant rainfall, or use internal records to justify the average lag required for your soil types and materials.
Keep in mind, owners may resist adding dry out days unless you can show, with records, that the work really cannot safely resume the next day. Written logs from past projects, with photo backup, are persuasive here.
See how RainDelayLog handles this for commercial construction
How federal agencies publish their own monthly weather day tables
Federal projects set the standard for defensible weather day allowances. Agencies like the Army Corps of Engineers and the General Services Administration publish their own tables based on decades of NOAA data, tailored for each region and major city.
These tables list, by month, the number of days expected to be lost to adverse weather, broken down by precipitation and temperature. They also specify the thresholds used, such as 0.10 inch of rain or a high temperature below 40 degrees Fahrenheit. For projects on federal land or funded by federal money, these tables are often non-negotiable, and contractors are required to use the published numbers.
While not binding outside federal contracts, these tables are often used as benchmarks in disputes. If your own allowance is higher or lower than the published government table, be ready to show why, site specifics matter, but federal tables carry weight in negotiation and claims.
Tracking actual days against the baseline while the job runs
Once the baseline is set and the project starts, the work shifts to tracking. Every adverse weather day must be logged, with enough detail to document the site conditions and explain which work could not proceed. This is where many claims succeed or fail. If the log is incomplete, or just copies the weather report, it may not stand up in dispute resolution.
What to record
Each day with adverse weather needs its own entry. Record the date, the weather condition (rain, wind, cold), the measured amount, and the specific scopes affected. Include photos if possible. Note the actual work missed, not just that the site was wet. Owners will ask if you could have shifted to interior or unaffected tasks. Clear documentation of which trades and areas were idle is crucial.
Comparing to the baseline
At the end of each month, tally the actual adverse weather days against the baseline in your table. If the job loses more days than the allowance, document the overage clearly and provide the logs. For projects with rolling allowances, update the total as the job progresses. Both sides should agree on the running total, to avoid surprises at the end.
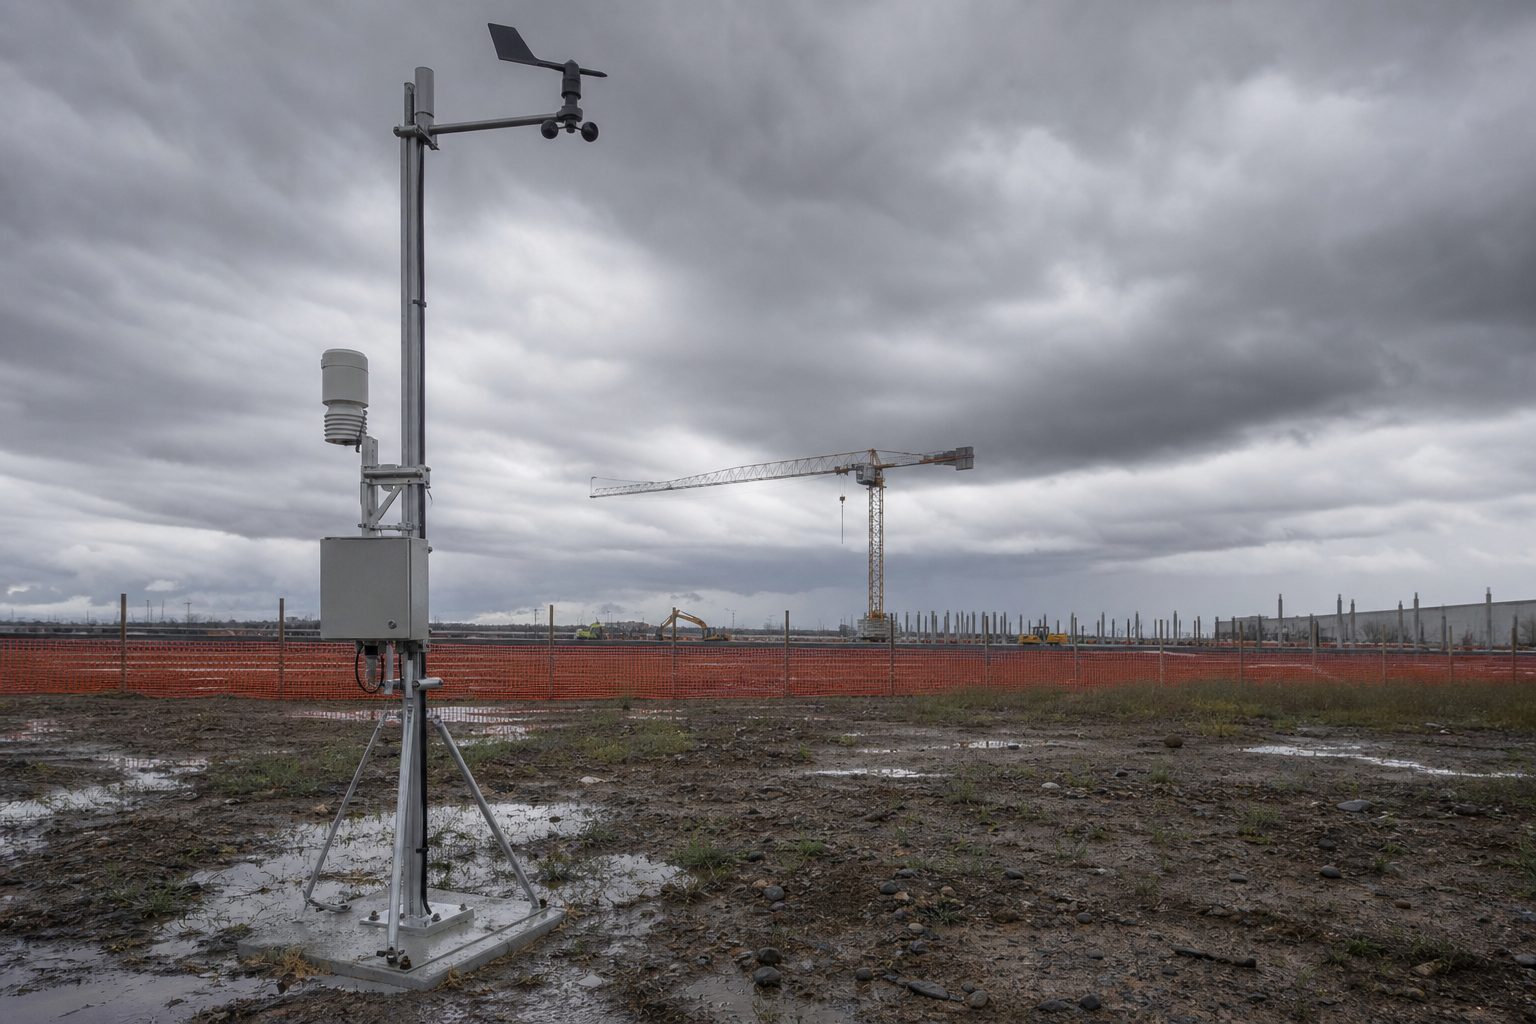
Many disputes come from poor documentation. A daily log with third-party weather capture, such as an on-site weather station or automated feed, carries more weight than a handwritten note. Consistency is key. Missing days or vague entries weaken your position if a claim goes to mediation or court.
Where a baseline table protects you and where it works against you
A well-built baseline weather day table sets expectations and limits risk for both sides. For contractors, it means you are not punished for losing days that were, by long-term data, inevitable. You have a clear path to a schedule extension if the project faces unusually severe weather, backed by both the contract and the site log. For owners, it caps the number of days that qualify as excusable delay, keeping the project on track and closing the door to open-ended weather claims.
However, the baseline can work against you if it is set too high or too low. Overestimating the number of anticipated adverse weather days may make your bid less competitive, or leave you with no relief when a wet season hits harder than the norm. Underestimating can lead to disputes, claims, and damaged relationships. If the table does not match actual site conditions, both sides may find themselves fighting over what should have been a predictable issue.
The key is transparency: use the best available NOAA data, set thresholds that reflect your real work, and document every day with clear, site-specific records. Many contractors now rely on daily site log tools that capture weather data automatically and generate defensible delay documentation. With this approach, both the baseline and the actual record are ready when you need them, on the job and at the negotiation table.